Key Takeaways
Strip away indicators — one chart and one moving average is enough
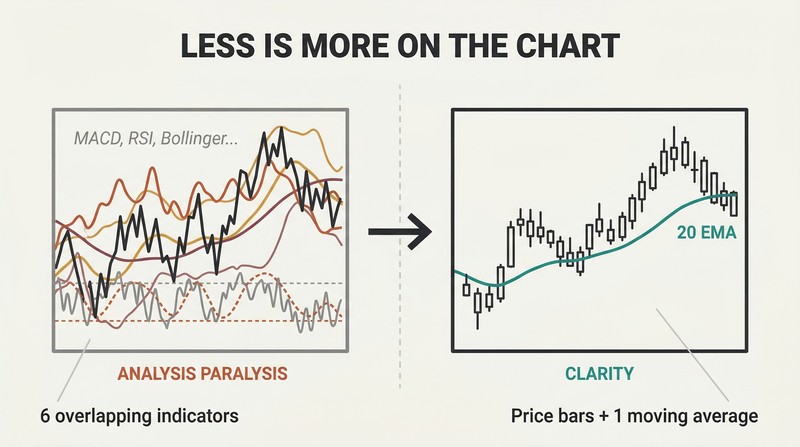
Brooks spent over 10,000 hours testing indicators and automated systems before concluding they obfuscate rather than elucidate. He now trades exclusively off a single 5-minute candle chart with a 20-bar exponential moving average — no oscillators, no MACD, no Bollinger Bands. His reasoning: every indicator is derived from price action, so you're looking at a delayed, filtered version of what's already on the chart. When multiple setups appear simultaneously, you simply can't process several indicators fast enough to place accurate orders.
The temptation to add complexity is powerful. Beginners assume Goldman Sachs must use some supercomputer with secret software. But Brooks argues that even Goldman's edge comes from reading price action well and trading institutional volume. Adding inputs beyond a single chart creates analysis paralysis and causes you to miss clear setups hiding in plain sight.
Read every bar as an institutional footprint showing who's in control
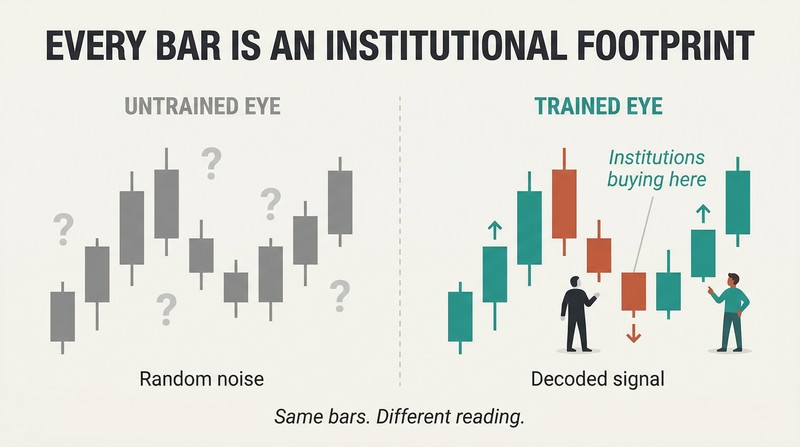
Most traders dismiss quiet bars as noise or irrelevant program activity, but Brooks insists every bar carries the same volume as the bars traders find significant. Whenever the market goes up, institutional money is predominantly buying; whenever it goes down, they're predominantly selling. You can't hide volume. Your job is to piggyback onto their trades — not predict, just follow.
The practical application changes everything. Strong bulls buy below prior swing lows — exactly where weak traders get stopped out. If the market keeps rising despite a bearish-looking pullback bar, institutions are buying that bar. Brooks compares this to reading a chest X-ray: most people see nothing, but a trained eye spots patterns everywhere. Each bar is a data point institutions cannot conceal.
Trade with market inertia — most reversals and breakouts fail
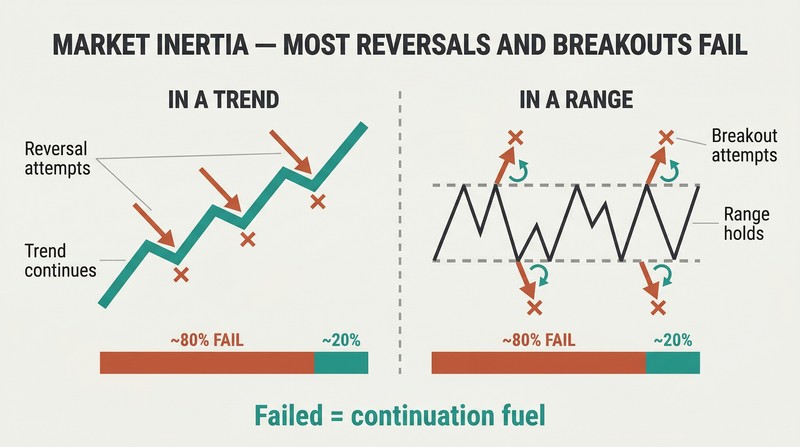
Market inertia is the most exploitable tendency in price action. About 80% of attempts to reverse a trend fail and become continuation flags. Similarly, about 80% of attempts to break out of a trading range fail. This is the opposite of coin-flip reasoning, where beginners assume three losses mean the next trade must win.
This principle should govern every trade. In a bull trend, most sell setups fail — so stop hunting perfect short entries and start buying imperfect pullbacks. In a trading range, fade the extremes rather than chasing breakouts. Smart traders wait for the reversal attempt to fail, then enter with the trend exactly where trapped countertrend traders are forced to exit at a loss. Their panic becomes your fuel.
The strongest trends deliberately look weak to trap traders out
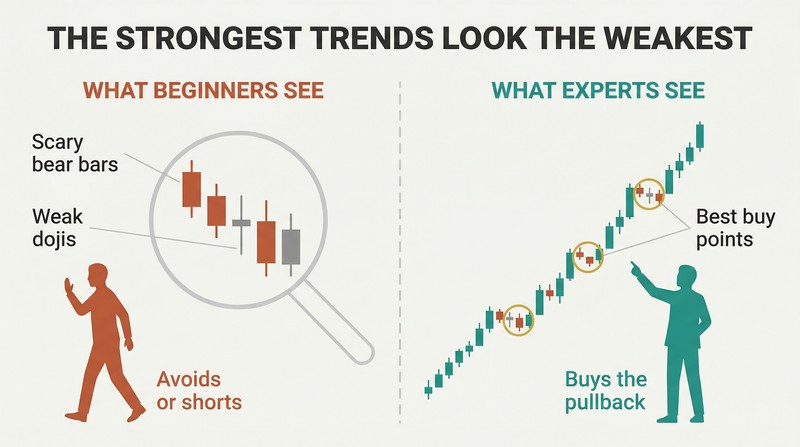
On small pullback trend days — the strongest type of trend, occurring once or twice monthly — virtually every countertrend setup looks better than the with-trend entries. Bear trend bars and multi-bar bear spikes appear constantly in bull trends, trapping beginners into repeated shorts. Meanwhile, the buy signal bars are small dojis or even bear bars. They look terrible.
This is how strong trends sustain themselves. If entries were obvious, everyone would take them, the move would be small, and no one could swing for large profits. Experienced traders recognize the telltale combination: weak-looking signal bars + pullbacks that never reach the moving average + no two consecutive closes on the wrong side of the EMA = an extremely strong trend. Bad-looking entries are the highest-probability swings.
Every trend has two phases: an urgent spike, then a worried channel
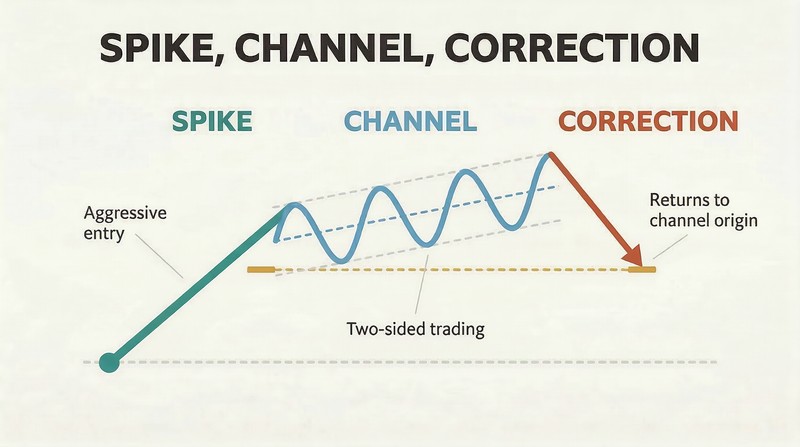
Spike and channel is Brooks's most essential structural framework. The spike is a breakout — one or more strong trend bars where both bulls and bears agree the current price is wrong, so the market rushes to a new level. After a pause or pullback, the channel begins: momentum slows, bars overlap, and two-sided trading appears. Brooks calls this "the wall of worry."
Trade each phase differently. During the spike, enter aggressively — at the market, on strong closes, or on tiny pullbacks. During the channel, treat it as a sloping trading range where the trend constantly looks like it's ending but isn't. Once the channel finally breaks, expect a correction back to the channel's starting point. Some form of this pattern appears every single day.
Use the always-in test to stay on the right side of the market
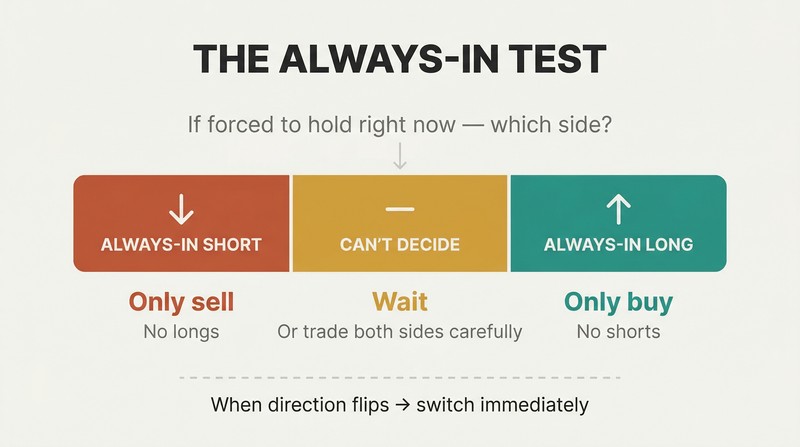
The always-in concept simplifies trading's most paralyzing question: "What do I do right now?" Imagine you must hold a position at all times — long or short. If the answer is clearly long, only buy. If clearly short, only sell. If you can't decide, the market is in a trading range — either wait or trade both sides carefully.
This mental model prevents the costliest beginner mistake: shorting a bull trend because it "looks overdone." When the always-in direction flips — typically after a strong spike with follow-through in the new direction — switch immediately. Brooks is emphatic that most traders should trade only in the always-in direction. Countertrend trades require a prior trend line break, a strong reversal bar, and ideally a second entry.
Never act on a signal bar until it closes — final seconds matter
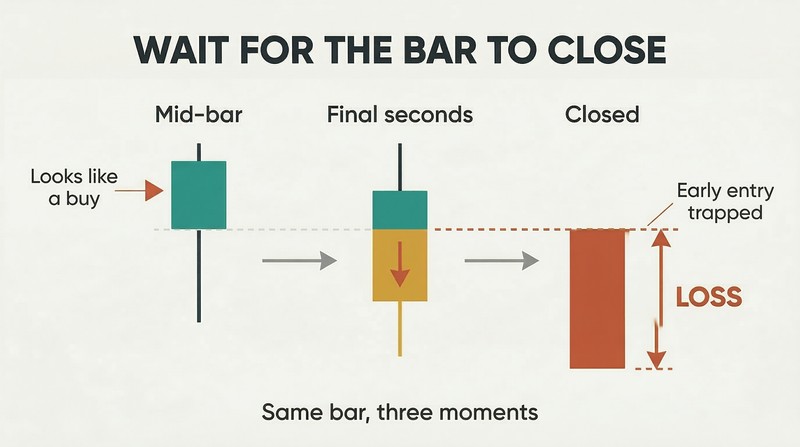
The final seconds of a bar can completely reverse its meaning. Brooks describes a recurring trap: a perfect bull reversal bar forms at a climactic bottom, traders enter early for a better price, then with five seconds remaining the price collapses and the bar closes on its low. Premature longs lose two points or more. This happens multiple times daily, and you need roughly eight successful early entries to offset each one that reverses — odds Brooks says "simply won't happen."
The only exception is entering with-trend during an obvious strong spike, where waiting risks missing the entire move. For countertrend entries, patience is non-negotiable. Brooks also warns against switching to a 1-minute chart to manage 5-minute trades — the smaller chart tempts you with tighter stops that consistently get hit.
The chart prices in all fundamentals — news and TV add only noise
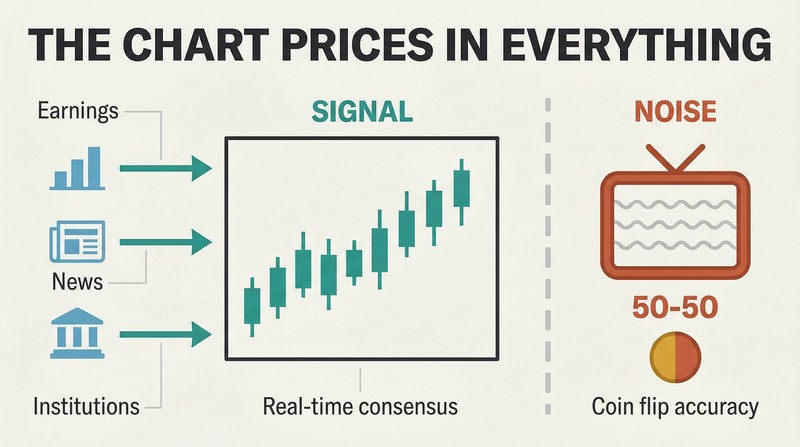
When Costco reported 32% earnings growth above expectations, the stock gapped up, rallied briefly, then crashed $3 below the prior day's low. A price action trader would have shorted the failed trend line break at the moving average — no report needed. When Microsoft offered to buy Yahoo at $31, the stock rallied to the offer, then collapsed 50% over six months. Fundamentals failed; the chart worked.
Brooks's rule is absolute: never watch financial news while trading. Television pundits are selected for charisma, not accuracy — their predictions are essentially 50-50. If a Wall Street head trader could consistently predict short-term direction, he'd make 1,000% annually day trading instead of managing money. The chart shows institutional consensus in real time; everything else is slower and less reliable.
Expect two legs in every correction, breakout, and reversal
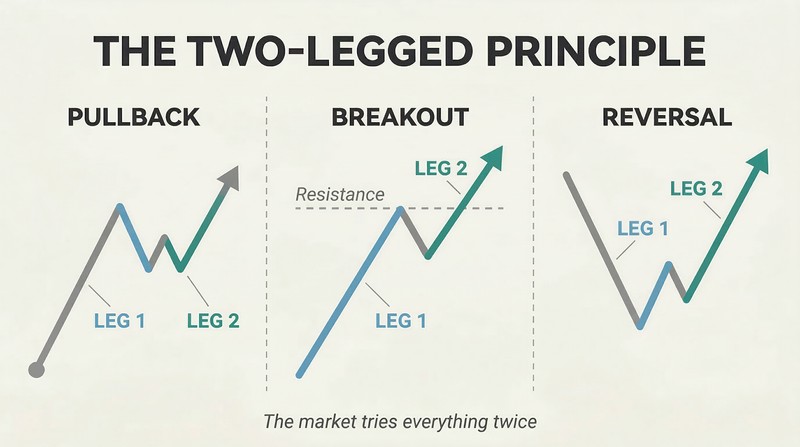
Two-legged moves pervade every time frame. Pullbacks typically have two pushes (ABC corrections). Trends subdivide into two major legs. After a sell climax, expect a correction with at least two legs lasting about 10 bars. After a trend line break, expect a test of the trend's extreme. Brooks tracks these systematically through bar counting: in a bull pullback, the first bar breaking above the prior bar's high is a High 1; the second occurrence is a High 2 — his bread-and-butter entry setup.
This framework builds patience. Knowing a second leg is likely helps you hold through a painful first pullback instead of panicking out. It also prevents chasing after just one leg. When the market fails twice at something — like breaking below support — it usually tries the opposite.
Treat every bull channel as a bear flag about to break
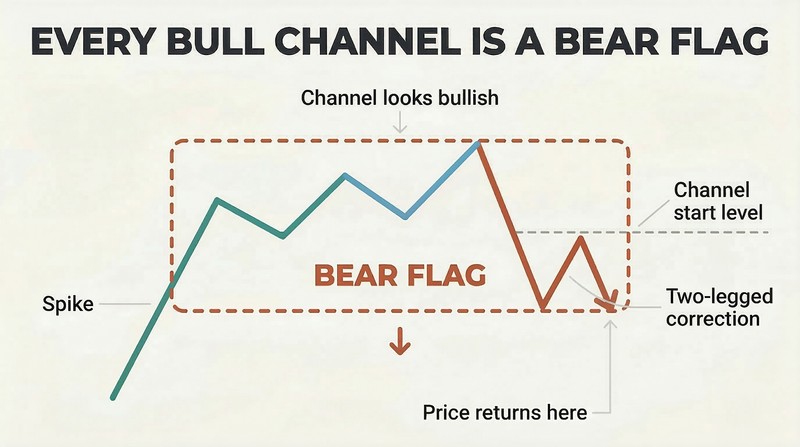
Every rising channel eventually breaks to the downside — making it functionally a bear flag — regardless of how bullish it appears. The channel's starting point is usually tested within a day or two; the entire channel is merely the first leg of a forming trading range. In a spike and channel bull: the market spikes up, channels higher, then breaks below the channel and corrects to the channel's start, creating a double bottom bull flag and revealing the trading range.
Experienced bears exploit this by scaling into shorts throughout bull channels — selling above swing highs and above prior bar highs — planning to take profits when the market tests the channel's starting point. Most upside breakouts from bull channels fail within five bars and lead to two-legged corrections. The channel phase constantly looks like it's reversing, but rarely does — until it finally does.
Analysis
Al Brooks's Trading Price Action Trends occupies a peculiar position in trading literature: simultaneously one of the most comprehensive and most difficult books on markets. Brooks, a former ophthalmologist turned Emini day trader, spent over a decade failing before distilling an approach relying entirely on naked price charts and a single moving average. The book's central contribution is not a trading system — Brooks explicitly argues reliable rules cannot exist in a zero-sum game — but rather a perceptual framework for reading institutional intent bar by bar.
The intellectual architecture rests on a compact set of structural claims: markets exhibit inertia (trends persist, ranges contain), every trend follows a spike-and-channel structure, two-legged moves are the market's natural subdivision, and edges are always small and fleeting. What makes the book genuinely novel is Brooks's insistence that every bar matters. Where most technical analysis texts highlight three or four formations on a chart, Brooks argues dismissing any bar as noise is financially reckless — institutional algorithms encode meaningful information into every tick.
The book's most counterintuitive insight may be that the strongest trends produce the worst-looking entry signals. This creates a selection bias systematically removing underprepared traders from profitable positions. Brooks describes an adversarial information environment where clarity is expensive and confusion is the market's default product. His constant refrain — 'close is close enough' — reveals a pragmatist's epistemology: perfection in pattern recognition is impossible, and demanding it guarantees missing the trade.
Critics rightly note readability challenges — Brooks himself acknowledges the difficulty. The prose is recursive and dense. Yet this density mirrors the actual cognitive load of real-time trading. The book doesn't teach a system; it rewires perception. Its lasting value lies in training traders to see institutional footprints where others see randomness — a skill that, as Brooks's violin metaphor suggests, requires thousands of hours of deliberate practice after understanding the theory. The comparison to chess is apt: nothing is hidden, yet mastery remains rare.
Review Summary
Readers find Trading Price Action Trends dense but valuable for understanding market behavior and price action trading. Many praise its detailed insights, though some criticize the writing style as convoluted and repetitive. Opinions vary on its suitability for beginners. The book is part of a trilogy and includes chart analysis and trading setups. While some readers struggle with the lack of visual aids and organization, others consider it essential for serious traders. Overall, it's seen as a comprehensive resource for developing price action trading skills.
Glossary
always in
current forced-position directionA framework where you assume you must always hold either a long or short position. At any moment, the always-in direction is whichever side you would choose if forced to decide immediately. It helps traders identify the dominant trend direction and avoid countertrend trades. The always-in direction flips when a strong spike with follow-through reverses the prior trend.
signal bar
bar before the entry barThe bar immediately preceding the bar in which a trade is entered (the entry bar). It is the final bar of a setup pattern. A signal bar is labeled in hindsight—once an entry order is filled, the prior bar becomes the signal bar. Every bar is a potential signal bar for both long and short trades until context determines which direction, if any, is tradable.
spike and channel
two-phase trend structureThe most common trend pattern, consisting of two phases. The spike is a strong, urgent breakout of one or more trend bars with little overlap, where the market rapidly moves to a new price level. The channel follows after a pullback, characterized by slower momentum, overlapping bars, two-sided trading, and a sense of worry. The channel eventually breaks, usually correcting back to its starting point.
trend bar
bar with meaningful body directionA bar where the close is meaningfully away from the open, indicating one side controlled the bar. A bull trend bar closes above its open (white/hollow candle body); a bear trend bar closes below its open (black/filled body). All bars are classified as either trend bars or doji bars (nontrend bars where neither side dominated). Every trend bar is simultaneously a spike, breakout, gap, and climax.
High 1, 2, 3, 4
pullback leg counter for bullsA bar counting system for pullbacks in bull trends or trading ranges. In a downward or sideways move, the first bar whose high exceeds the prior bar's high is a High 1 (ending the first leg down). If the pullback continues and a second such bar forms, it is a High 2 (ending the second leg). High 2 entries in bull trends are Brooks's most reliable pullback buy setups. High 3 is often a wedge bull flag. Low 1-4 is the inverse for bear trends.
buying pressure
cumulative bull trend bar forceThe cumulative effect of trend bars, bars with tails at bottoms, and two-bar bull reversals appearing in a bear trend or trading range. As more and larger bull bodies accumulate, the buying pressure reaches a critical point that eventually overwhelms sellers and drives the market higher. Selling pressure is the bearish equivalent. Both are cumulative—individual bars contribute to a growing force that eventually produces a directional breakout.
breakout pullback
pullback following a breakoutA small pullback of one to about five bars occurring within a few bars after a breakout. Because it is viewed as a pullback rather than a failed breakout, traders expect the breakout to resume and use the pullback as an entry setup. Breakout pullbacks can form higher lows, lower lows, or even lower highs relative to the breakout point and still be valid setups.
trader's equation
probability-weighted risk-reward formulaThe principle that to take a trade, the probability of success multiplied by the potential reward must be greater than the probability of failure multiplied by the risk. Reward equals distance to profit target; risk equals distance to protective stop. Brooks recommends assuming 50% probability when uncertain and 60% when confident, and advises most traders to never risk more than their expected reward.
micro channel
tight channel with no pullbacksAn extremely tight channel where most bars touch both the trend line and trend channel line, with no pullbacks or only one or two tiny ones. It is the most extreme form of a tight channel and indicates very strong momentum. The first breakout usually fails, setting up a with-trend entry. On higher time frames, a micro channel typically appears as a single strong trend bar or a spike.
final flag
last flag before trend reversalThe last continuation pattern (flag) in a trend before the market reverses or enters a significant correction. Often identifiable as a tight trading range forming after 10 or more bars of trending, especially if it is unusually small or tight. The breakout from a final flag in the trend direction is brief, quickly reverses, and leads to a move in the opposite direction.
vacuum
absence creating rapid price movementOccurs when strong traders on one side step aside and wait for the market to reach a target before trading. For example, in a bull channel approaching resistance, strong bears stop shorting because they expect higher prices soon, and their absence creates a buy vacuum that sucks the market quickly up to the resistance level. Once there, they sell aggressively, producing a sharp reversal.
barbwire
overlapping doji trading rangeA trading range of three or more bars that largely overlap, with one or more being doji bars. It features prominent tails and often relatively large bars. Barbwire represents intense uncertainty and two-sided trading. Most breakouts from barbwire fail due to its strong magnetic pull. Traders should generally avoid trading within barbwire patterns and wait for a clear breakout and setup.
FAQ
What's Trading Price Action Trends about?
- Focus on Price Action: The book emphasizes understanding price action as a key to successful trading, teaching traders to analyze price charts bar by bar.
- Comprehensive Strategies: It covers various trading strategies, including trend trading, trading ranges, and reversals, providing a detailed framework for traders.
- Institutional Insights: Al Brooks shares insights into institutional trading, helping readers understand market dynamics that influence price movements.
Why should I read Trading Price Action Trends?
- Expert Knowledge: Al Brooks is a seasoned trader with extensive experience, offering valuable insights for both novice and experienced traders.
- Detailed Analysis: The book provides a thorough analysis of price action, often overlooked in other trading literature, enhancing a trader's skill set.
- Improved Decisions: Learning to read price action effectively can lead to better trading decisions, potentially increasing profitability and reducing losses.
What are the key takeaways of Trading Price Action Trends?
- Understanding Trends: The book teaches how to identify and trade trends effectively, emphasizing the importance of recognizing trend bars and doji bars.
- Recognizing Breakouts: Readers learn to distinguish between successful breakouts and failures, essential for managing risk and maximizing profits.
- Importance of Context: Every bar on a chart has significance and should be analyzed in context, helping traders avoid common pitfalls.
How does Al Brooks define price action in Trading Price Action Trends?
- Broad Definition: Price action is any change in price on any chart or time frame, including every tick and bar.
- Trends and Ranges: The book categorizes price action into trends and trading ranges, crucial for developing effective trading strategies.
- Significance of Each Bar: Every bar provides valuable information about market sentiment and potential future movements.
What is the significance of trend bars and doji bars in Trading Price Action Trends?
- Trend Bars Indicate Control: A trend bar shows that either bulls or bears are in control, indicating strong price movement.
- Doji Bars Signal Indecision: A doji bar indicates a balance between buyers and sellers, suggesting market indecision.
- Context Matters: The effectiveness of trend and doji bars depends on their context within the overall price action.
What are some specific concepts covered in Trading Price Action Trends?
- Trend Lines and Channels: The book discusses how to draw trend lines and channels to identify market direction.
- Micro Channels: Introduces micro channels, tight channels indicating strong trends, helping identify entry points.
- Failed Breakouts: Emphasizes recognizing failed breakouts as potential trading opportunities.
How does Trading Price Action Trends address breakouts and failures?
- Identifying Breakouts: Teaches how to recognize breakouts from trading ranges and characteristics of successful breakout bars.
- Understanding Failures: Many breakouts fail; recognizing signs of a failed breakout is crucial for managing risk.
- Contextual Analysis: The effectiveness of a breakout is determined by the context, including previous price action and market conditions.
What role do institutions play in the concepts presented in Trading Price Action Trends?
- Market Control: Institutions are responsible for most trading volume, significantly influencing price movements.
- Smart Money Dynamics: Discusses "smart money," highlighting how institutional traders operate based on price action.
- Impact on Price Action: Institutional trading creates patterns in price action that can be exploited by individual traders.
What are some common mistakes traders make according to Trading Price Action Trends?
- Ignoring Context: Many traders fail to consider the context of price action, leading to poor trading decisions.
- Overtrading: Entering too many trades without sufficient analysis can lead to losses.
- Chasing Trends: Beginners may chase trends without waiting for confirmation, resulting in missed opportunities or losses.
What are the best quotes from Trading Price Action Trends and what do they mean?
- "Every chart has an incredible amount of information that can be used to make profitable trades.": Encourages thorough analysis of price action beyond obvious patterns.
- "The market is simply a collection of institutions.": Emphasizes the role of institutional traders in shaping market dynamics.
- "Trends require traders to keep missing entries.": Highlights the challenge of trading trends, where opportunities can be fleeting.
How can I apply the concepts from Trading Price Action Trends to my trading?
- Practice Drawing Trend Lines: Start by practicing drawing trend lines and channels on your charts to identify potential trading opportunities.
- Focus on Price Action: Shift your focus to price action analysis rather than relying on indicators.
- Be Patient with Setups: Wait for high-probability setups, such as breakout pullbacks or reversal patterns, before entering trades.
What are the different types of trends discussed in Trading Price Action Trends?
- Bull Trends: Characterized by a series of higher highs and higher lows, indicating upward momentum.
- Bear Trends: Features lower highs and lower lows, signaling downward momentum.
- Trading Ranges: Discusses trading ranges, where the market moves sideways between support and resistance levels.
About the Author
Other books by Al Brooks
Download PDF
Download EPUB
.epub digital book format is ideal for reading ebooks on phones, tablets, and e-readers.


