Key Takeaways
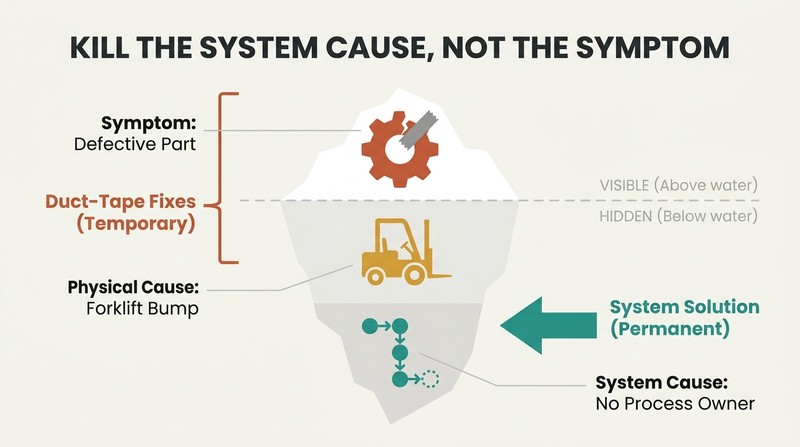
Most fixes are duct tape: kill the system cause, not the symptom
Symptoms, physical causes, system causes form a chain. A symptom is the visible signal something is wrong (wrong book shipped, late flight). A physical cause is the immediate reason (a worker grabbed the wrong item). A system cause is the deeper policy or process gap that let it happen (no reliable order-verification process). Okes argues organizations chronically slap on a "duct tape solution" that hides symptoms, so the problem returns and frustration loops.
The forklift parable makes it concrete. A machine makes defective parts. The damaged part gets swapped. But it was damaged because a forklift bumped it, because the painted floor-navigation line had worn away, because nobody owned line repainting. Only that last gap, the missing process, is the true root cause worth correcting.
Diagnose like a rifle, not a shotgun, through ten disciplined steps
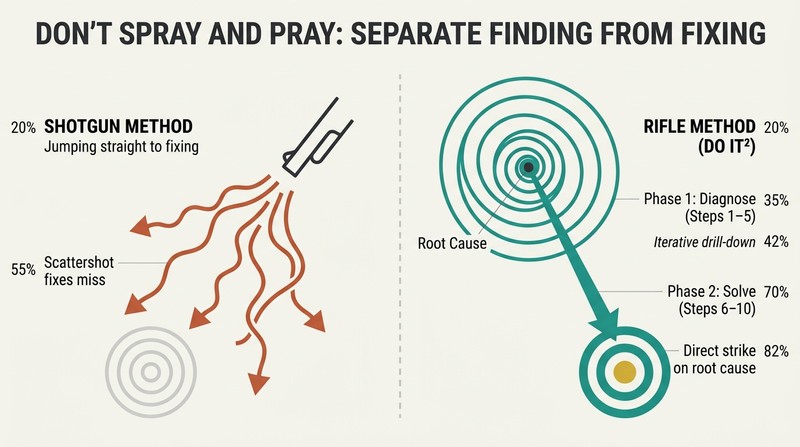
Separate finding from fixing. Okes's DO IT2 model splits problem solving into two phases: Steps 1 to 5 are diagnosis (define the problem, understand the process, identify possible causes, collect data, analyze data), and Steps 6 to 10 are solution (identify solutions, select, implement, evaluate, institutionalize). The five diagnostic steps are iterative, not linear. You cycle through them repeatedly, drilling down like asking "why" again and again until the cause sits between your boundaries.
It mirrors a doctoral dissertation. Identify a worthy problem, review what's known to form hypotheses about causes, then collect and analyze data to test each theory. Okes calls this "Six Sigma lite," the logic of finding causes without the heavy statistics, deliberately built so untrained employees can follow it where raw ISO or 8-D checklists leave them stranded.
A problem well stated is half solved, so quantify what, where, when
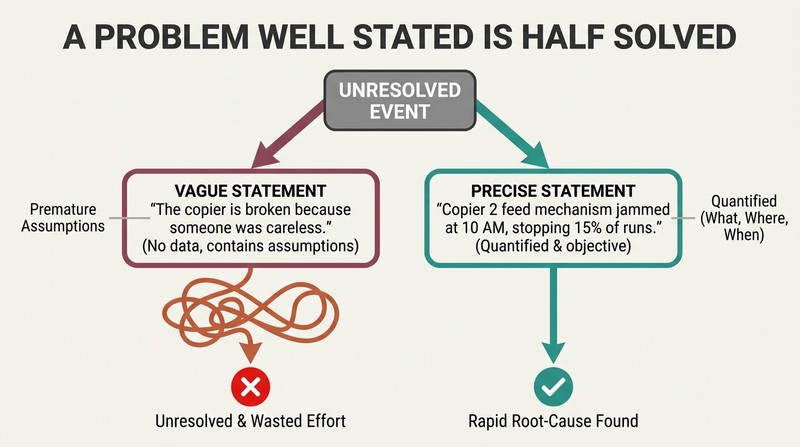
Vagueness wastes everyone's time. "The copier isn't working" tells you nothing useful. Telling a colleague to check the paper is likely a wasted errand when the toner, scan light, power, or feed mechanism could equally be at fault. A strong problem statement answers what happened, where (geographically, in the process, on the product), who is affected, when it began, and how much (absolute numbers plus percentages).
Exclude any hint of the cause. Okes warns that smuggling assumptions into the statement derails diagnosis. One company labeled dangerous equipment failures "accidental" and chased solutions for months, until it discovered the acts were intentional. Naming a suspected person or cause prematurely blinds you. Two hospitals comparing surgery times got nowhere until they realized each defined "operating room time" differently, a missing operational definition.
Ask "which process failed?" before you ask "who did it?"
Everything is a process. Before brainstorming causes, flowchart the steps between where the problem appeared and a sensible starting boundary, ideally four to eight boxes using action verbs. Okes uses SIPOC (Supplier, Input, Process, Output, Customer) to show any organization can be mapped this way. When output disappoints, something inside the process broke, usually because there were no standards, the standard was wrong, or the standard wasn't followed.
The dyslexic clerk reframes blame. A fitness club keeps misspelling members' names on cards. The owner scolds the desk clerk, who turns out to have dyslexia. Firing the clerk fixes only the physical cause; the real gap is a hiring or screening process that placed the wrong person in a spelling-dependent role. Quoting Sydney Dekker, Okes urges finding how people's actions made sense given their circumstances.
Spend your energy on the vital few causes, not the trivial many
Pareto runs through every step. The 80/20 rule, that a minority of causes drives the majority of impact, is Okes's philosophical thread. Faced with multiple independent causes (an order error could come from data entry, a software algorithm, or a packer), don't fix all simultaneously and disperse your energy. Attack the cause with the highest frequency, cost, or risk first, then decide whether the next one is worth pursuing.
Filters protect overloaded staff. Okes introduces "corrective action density": divide the number of corrective actions opened per period by headcount. A 250-person firm logging 400 actions a year (eight a week) has overwhelmed the few people who actually do diagnosis. The answer is a filter that screens which problems warrant full investigation versus which get logged and watched for recurrence, judged by frequency, cost, risk, and current workload.
Build a logic tree to drill causes without leaps of faith
Two complementary maps. A flowchart gives the horizontal, time-ordered view; a logic tree (or why-why diagram) gives the vertical, structural view. The logic tree is a simplified fault-tree that breaks a problem into incremental cause-and-effect branches with infinite depth. The copier that ejects blank paper: since a blank sheet was picked up and ejected, those steps work, so only the image-scan and image-transfer steps remain as suspects. Each branch eliminated kills all the micro-causes beneath it.
Forbid magical jumps. When a student blamed damaged product on "operator attitudes," Okes pushed back: an attitude cannot physically dent metal. Damage obeys physics and chemistry. Good branches read "inadequate training," not just "training." When stuck on one diagram, switch to the other, exploiting that the brain processes patterns both sequentially and spatially.
Test theories with data, because one fact can kill a false cause
Data means evidence, not just numbers. Step 4 hunts for the relationship between X (a suspected cause) and Y (the problem outcome). Run a thought experiment first: if this cause were the real one, where would evidence show up and in what form? Then collect via interviews, observation, records, scientific testing, pictograms, or check sheets. A clever swap test isolates causes: move step two between two identical lines and see if the failure follows it.
The bagging-machine case shows patience. Bags occasionally came out overweight. Full inspection revealed the heavy bags always appeared right after breaks. When idle but powered on, the machine's preload container overfilled. They couldn't redesign the machine, so they changed the procedure to shut it off when not running continuously. A child's logic captures the spirit: before yanking the fridge from the wall, just open the door and see if the light comes on.
Adding another inspection step is the weakest fix you can pick
Solution strength is a hierarchy. Drawing on the U.S. Department of Veterans Affairs, Okes ranks fixes: stronger ones physically change the process or environment, simplify, or mistake-proof; intermediate ones use job aids and reduce confusing similarities; weaker ones rely on training, warnings, and adding another check. The reflex to bolt on an inspection catches problems sooner but rarely prevents them, missing the whole point of corrective action.
Training is the comfort blanket. People reach for retraining because it shows due diligence in a courtroom, but if someone was already trained, retraining changes nothing unless you find why the first training failed. To generate stronger options, deliberately think differently: scale the problem up or down, use analogies, ask "what would X do," or suspend all limits. One firm that suspended constraints realized it could eliminate the mislabeled box entirely, since electronic data transfer had made the label obsolete. Favor Occam's razor: the simplest solution is usually best.
Check the X and the Y, because results can improve by accident
Verify both the fix and the outcome. After implementing, don't just confirm the problem (Y) improved; confirm the change (X) was actually carried out. Okes's solution-outcome matrix yields four cells, and two are traps. Y can improve even though X wasn't really implemented, often the Hawthorne effect, where performance rises simply because people know they're being watched. Conversely, X can be implemented perfectly yet Y stays bad, meaning you found the wrong cause or misunderstand the system.
Then institutionalize, or it reverts. Standardize documents, FMEAs, and training, spread the lesson to similar processes, and sustain the gain. The strongest tactic is making the old way impossible, for example removing the obsolete equipment. Until individuals fully internalize the change, the organization risks sliding back, so group and structural reinforcement matter as much as individual buy-in.
Your own biased brain is the biggest threat to honest diagnosis
Emotion hijacks logic. Okes catalogs cognitive biases that sabotage root cause work. Confirmation bias makes you hunt only for data supporting your pet theory. Anchoring makes you call a result "good" merely because it beat the last one. Recency makes you assume a recurring problem has the same cause as before. Availability bias, what Herbert Simon called "satisficing," makes you grab the easiest data rather than the most definitive. Recall error corrupts interview testimony.
The antidote is slowing down. Effective diagnosis requires getting the rational neocortex in charge instead of the reptilian fight-or-flight brain that arbitrary deadlines and a blame culture provoke. Okes borrows from critical thinking (state your assumptions explicitly), Buddhism (see things as they really are, don't criticize the people involved), and Stoicism (accept what is and look objectively at what you can change). When told "there's a bird in my house, what does it mean?" he replied, "it means there's a bird in your house."
Analysis
Duke Okes wrote this 2009 ASQ Quality Press volume to fill a specific void: management standards like ISO 9001 demand that organizations find causes and prevent recurrence, yet they provide only administrative scaffolding (who signs off, which form) and no cognitive guidance on how to actually think a problem through. The result, in Okes's memorable phrase from a course participant, is the "duct tape solution." His remedy is the DO IT2 ten-step model, deliberately positioned as "Six Sigma lite," the deductive logic of cause-finding stripped of intimidating statistics so ordinary employees can use it.
The book's intellectual backbone is sound and somewhat underappreciated outside quality circles. It fuses Popperian falsification (theories die by data, never get proven), the hypothesis-test structure of academic research, and a humane systems view drawn from Deming, Dekker, and Reason. Its sharpest contributions are the three-tier symptom/physical/system cause taxonomy with a clean operational test (can you replace it, or must you rewrite a policy?), the corrective-action-density metric that makes organizational overload measurable, and the solution-strength hierarchy that exposes inspection-and-retraining as the cop-outs they usually are.
The limitations are ones Okes states plainly. The model assumes reasonably well-understood cause-and-effect relationships, so it weakens with novel technology, highly complex interacting systems, and bidirectional or nonlinear dynamics. It targets repetitive problems, not major accident investigations, which he addresses only briefly. And the Pareto-everything philosophy, while resource-rational, can mislead in high-consequence domains where every contributing factor matters.
What elevates the book beyond a tool catalog is its final turn toward philosophy and cognitive bias. Okes recognizes that diagnosis fails on human psychology more than on technique: blame cultures, arbitrary deadlines, and confirmation bias drive people to shallow answers. His invocation of critical thinking, Buddhism, and Stoicism is not decoration but the deepest practical insight, that finding truth requires the discipline to slow down, state assumptions, and see things as they are rather than as fear or convenience would have them.
Glossary
DO IT2 model
Ten-step problem-solving frameworkOkes's signature ten-step model split into a diagnostic phase (Steps 1 to 5: define the problem, understand the process, identify possible causes, collect data, analyze data) and a solution phase (Steps 6 to 10: identify solutions, select, implement, evaluate, institutionalize). The five diagnostic steps are iterative, cycling repeatedly to drill down to the true cause, and the whole model maps onto the Plan-Do-Check-Act cycle.
Physical cause vs. system cause
Immediate reason vs. underlying gapOkes's core distinction. The physical (or direct, proximate) cause is the immediate reason a problem occurred, often fixable by simply replacing something. The system (or latent, distal) cause is the deeper organizational policy or process gap that allowed the physical cause to happen, and only it counts as the true root cause, since correcting it requires changing how the organization operates.
Corrective action density
Corrective actions divided by headcountA metric Okes proposes for gauging whether an organization is overloaded with investigations: divide the number of corrective actions opened in a period by the number of employees. A high ratio (for example, 400 actions among 250 staff) signals that the few people who do diagnosis are swamped, justifying a filter that screens which problems truly warrant full root cause analysis.
Logic tree
Branching why-why cause diagramAlso called a why-why diagram, a simplified fault-tree that breaks a problem into incremental, logically connected cause-and-effect branches with potentially infinite depth. The top is the problem statement; each lower level answers why or how the level above occurred. Eliminating one branch eliminates all detailed causes beneath it, and adding levels naturally leads from physical causes down to system causes.
SIPOC
Supplier-Input-Process-Output-Customer mapA diagramming technique standing for Supplier, Input, Process, Output, Customer, used to show that any organization or activity can be viewed as a process. It clarifies what a process receives and from whom, what it produces and for whom, and how quality is measured, helping problem solvers set boundaries and orient diagnosis around process rather than blame.
Solution strength hierarchy
Ranking fixes from strong to weakAdapted from the U.S. Department of Veterans Affairs, a ranking of corrective actions. Stronger fixes physically change the process or environment, simplify, or mistake-proof. Intermediate fixes use job aids and reduce confusing similarities. Weaker fixes rely on training, warnings, and adding inspection steps. Okes stresses that the common reflex of retraining or adding a check is the least durable response.
Solution-outcome matrix
Verify both fix and resultA four-cell check used after implementation. It pairs whether the change (X) was actually carried out against whether the outcome (Y) improved. Two cells are traps: Y improving without X (often the Hawthorne effect) and X implemented while Y stays bad (wrong cause found). It forces verification that the intended fix happened, not just that the metric moved.


